
Soiling Sense — MEMS Vision Outdoor Soiling Detection
MSV9608 leverages Microsense Vision’s proprietary MEMS Vision optical sensing to provide outdoor-grade, high-illumination-resistant, low-power soiling detection for photovoltaic modules. Continuous measurements enable trigger-based cleaning, reducing O&M cost and energy loss while lowering LCOE.
- Designed for harsh outdoor sunlight, high reflectance, dust/salt-mist conditions
- Outputs integrate with SCADA/gateways; supports thresholds and alert-driven maintenance
- Multi-point deployment reflects spatial variability; supports Soiling Ratio / IWSR analytics

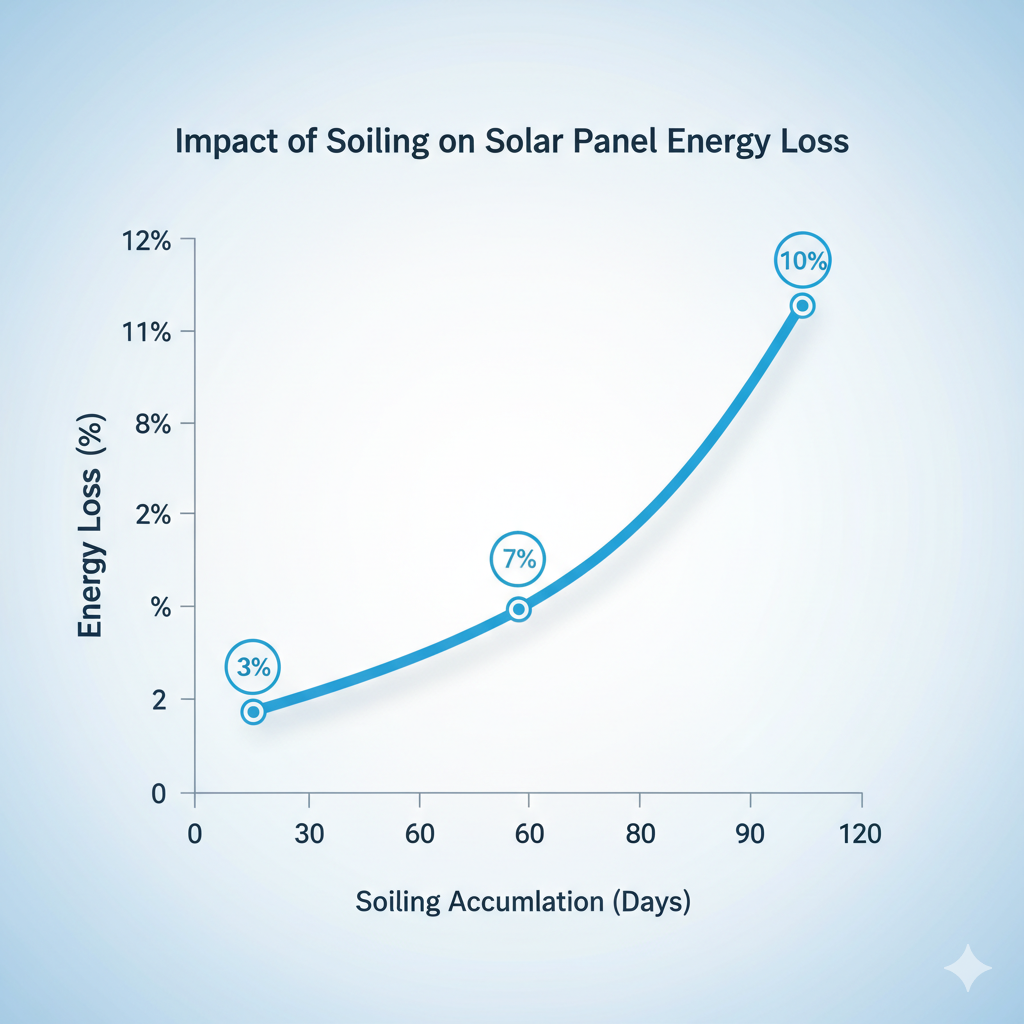
Why Soiling Detection Matters
In real sites, soiling (dust, pollen, salt, industrial residues) reduces irradiance reaching the cells and lowers MPP. Studies report 3–7% average annual energy loss across many locations, with 10–20% peak drops during severe events. Fixed-interval cleaning often leads to over-cleaning or late cleaning. Measurement-triggered strategies are essential to optimize revenue and O&M cost.
How It Works
MSV9608 uses MEMS Vision optical sensing and algorithms to estimate surface soiling on PV modules, outputting a Soiling Ratio (and optionally mapping to an IWSR-like indicator). The module supports periodic/ event reporting and threshold alerts for seamless integration with SCADA, data gateways, and cleaning policies.


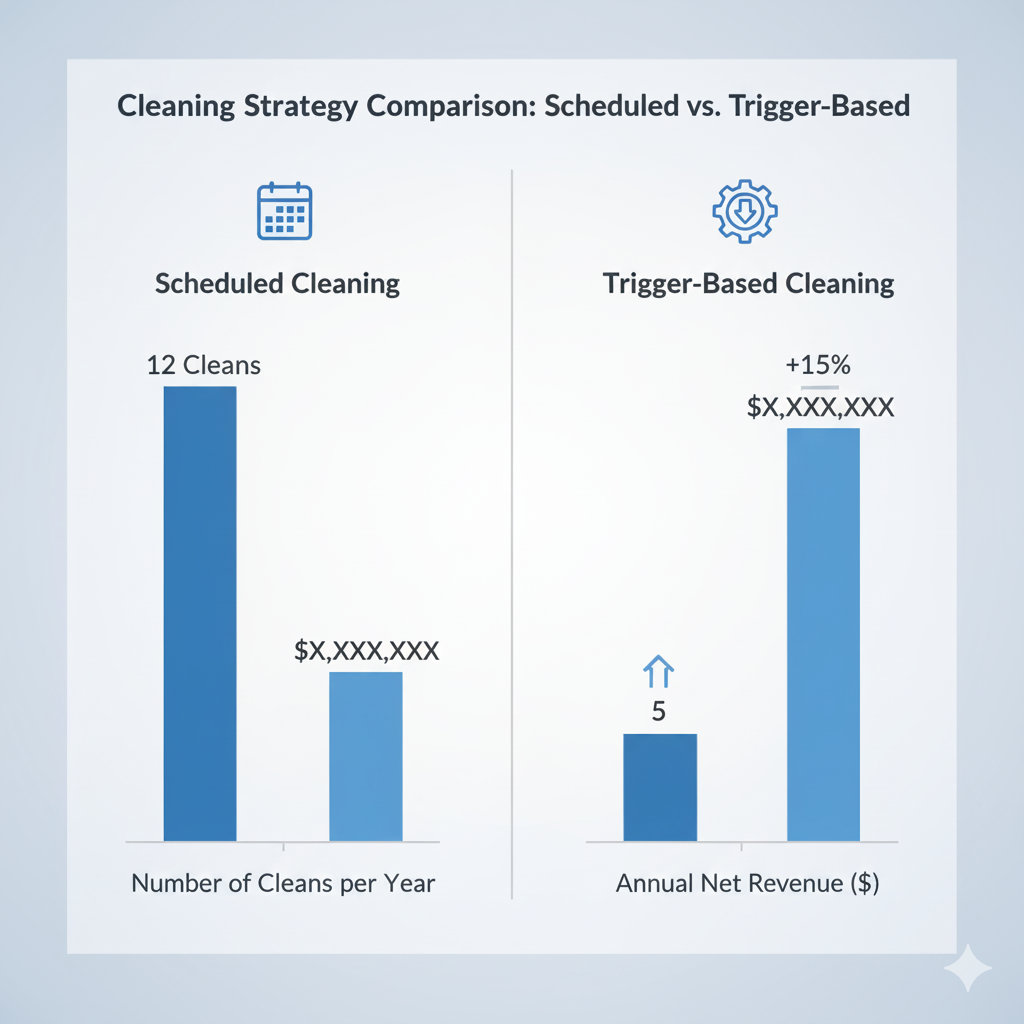
Economics — Clean When It Pays
A measurement-triggered cleaning strategy reduces both cleaning frequency and energy loss. The workflow is simple: Measure the Soiling Ratio → Model (IWSR, energy price, cleaning cost) → Trigger when thresholds are met. The charts below compare annual outcomes for fixed-interval cleaning versus trigger-based cleaning.

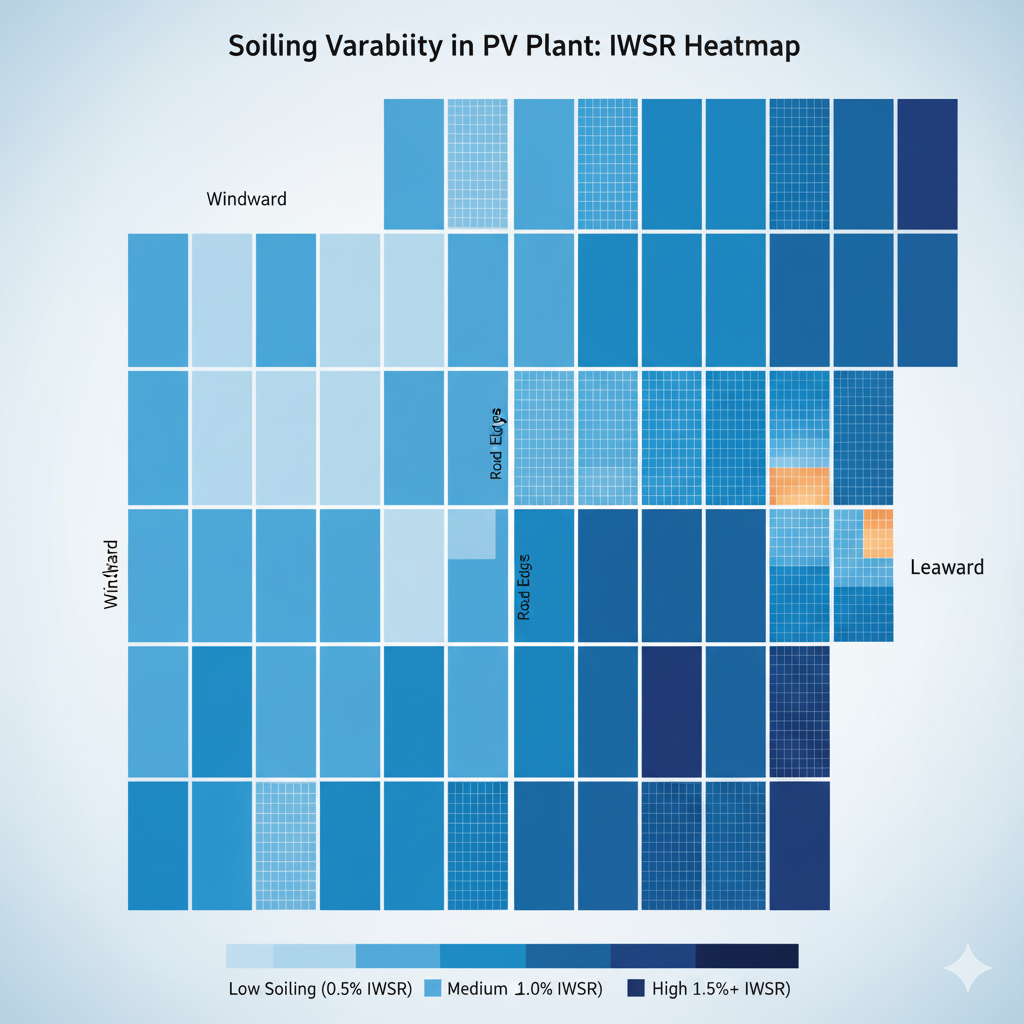
Deployment — Where to Place Sensors
Place sensors along windward/leeward edges, near boundary roads, and across zones with different tilt or cleaning groups. For large plants, multi-point deployment captures spatial variability, enabling Soiling Ratio maps and threshold-based cleaning policies.

Make Cleaning Data-Driven
Use MSV9608’s continuous measurements to enable trigger-based cleaning, reduce LCOE, and stabilize performance ratio and cash flow.